Welcome To My Site

Skills
Lifelong learner always picking up new skills!
Data Viz
Skilled in Data Viz platforms such as Power Bi, Tableau, Looker Data Studio, and MS Excel.
Well Spoken
Versed in multiple coding languages. Python, R, HTML5, C, C++, M, DAX, MD, SQL.
Teaching Platforms
Experience in Blackboard Ultra, Microsoft Teams, BrightSpace D2L, and Canvas.
Data Analysis
Experienced in data analysis and reporting. Skilled in apply multiple programs and languages to analyzing, cleaning, and presenting findings.
Resume and Certifications
Featured Projects
A few of my favorite projects are listed below. Take a look!
-
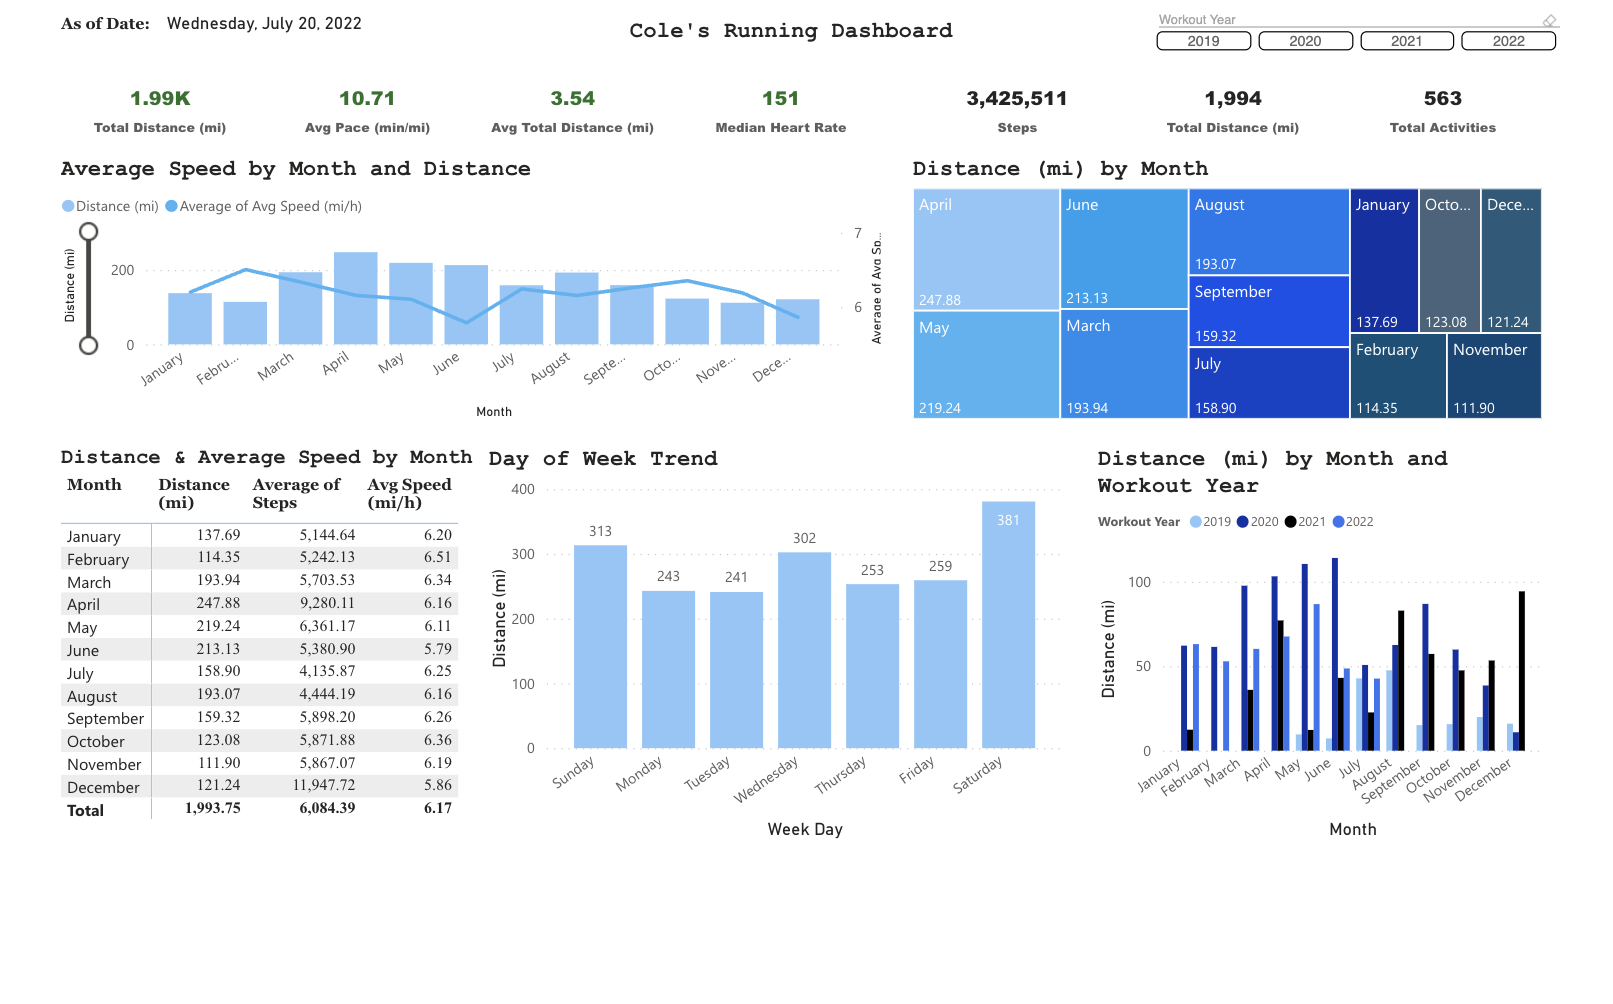
Power Bi MapMyRun Dashboard
A look at five years of data from my MapMyRun app.
-
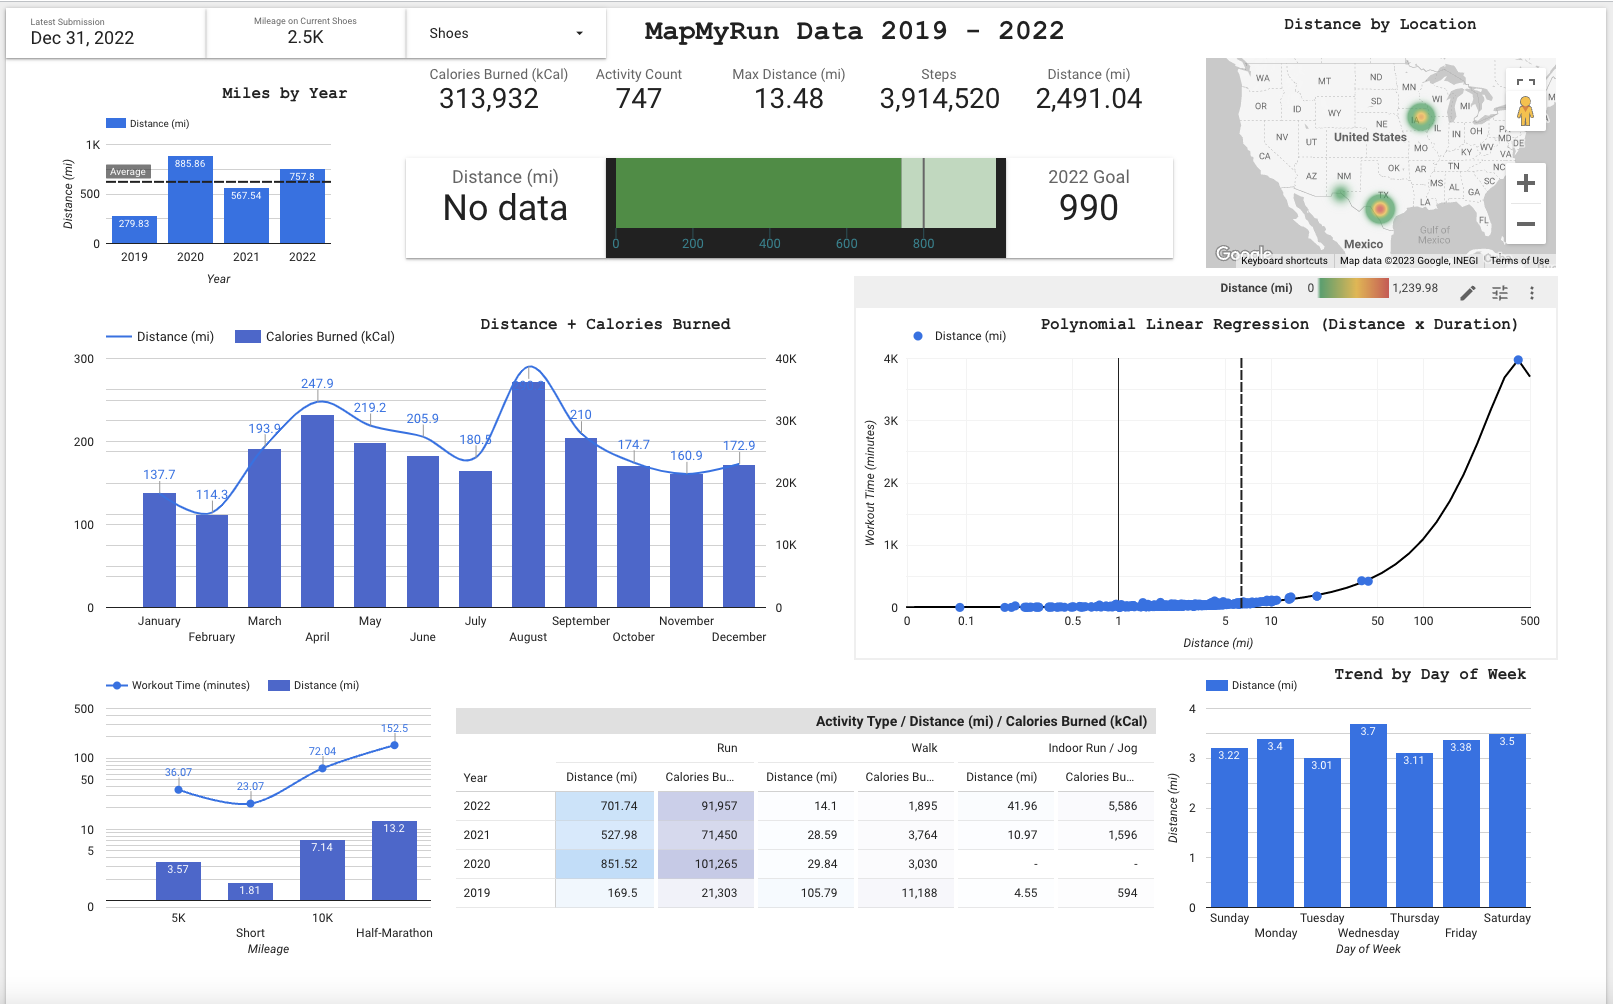
Looker Data Studio MapMyRun Dashboard
A deeper look at my MapMyRun data using Google tools.
-
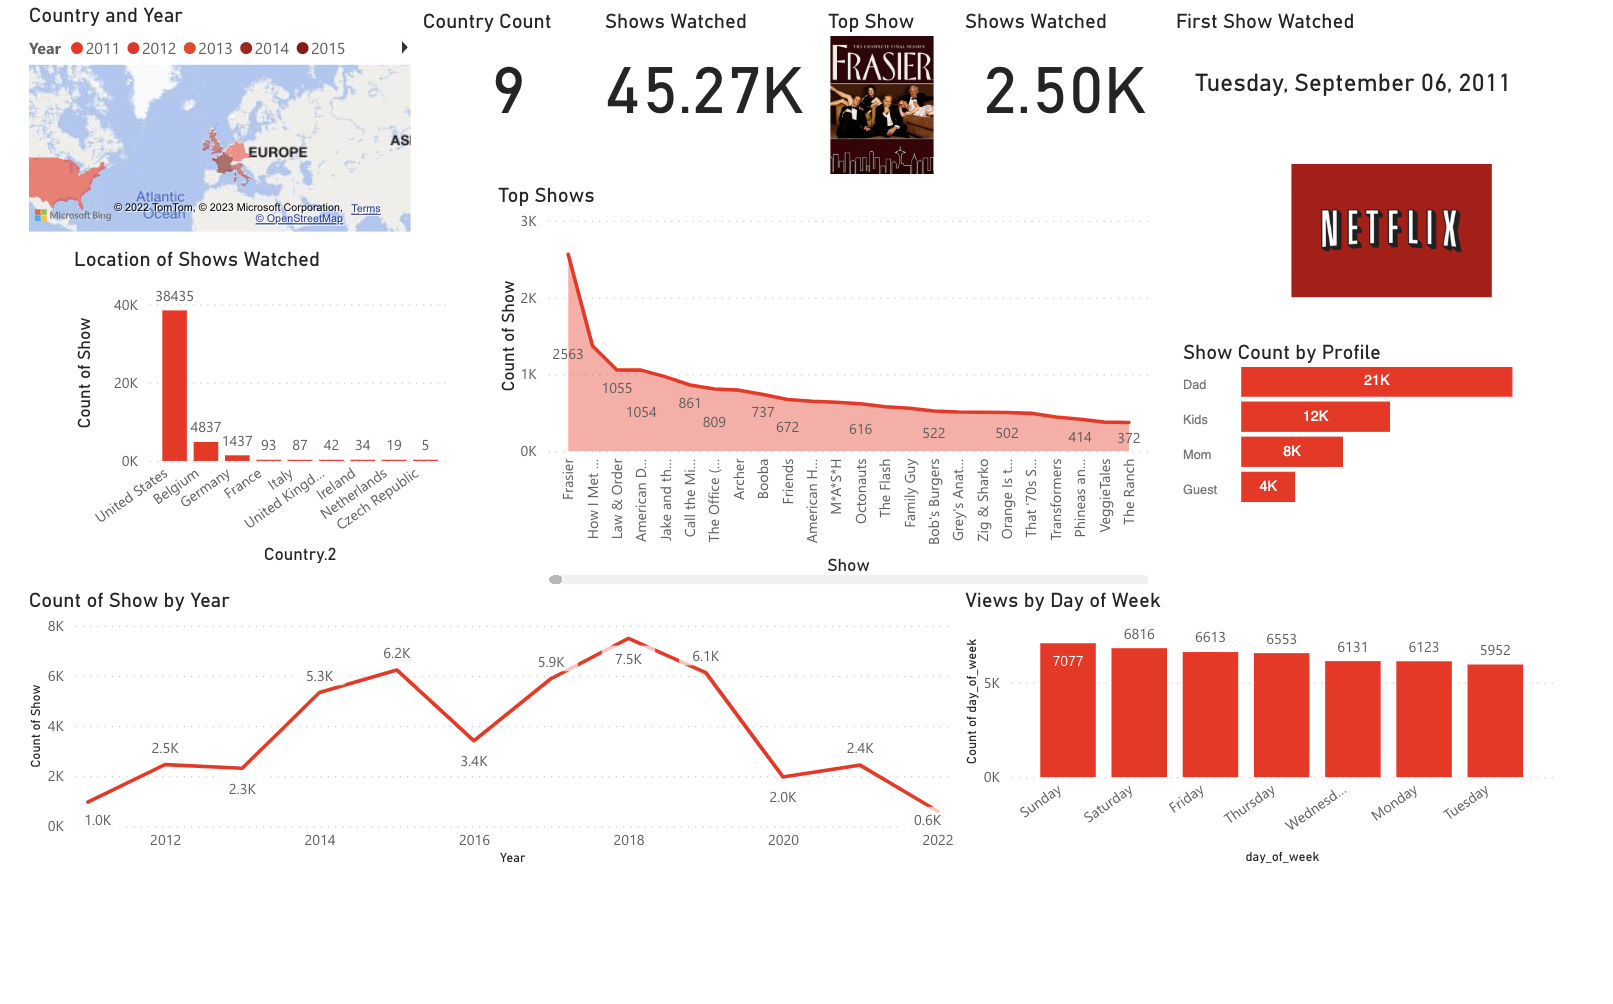
Netflix Dashboard
A fun look at my Netflix viewing history over ten years.
-
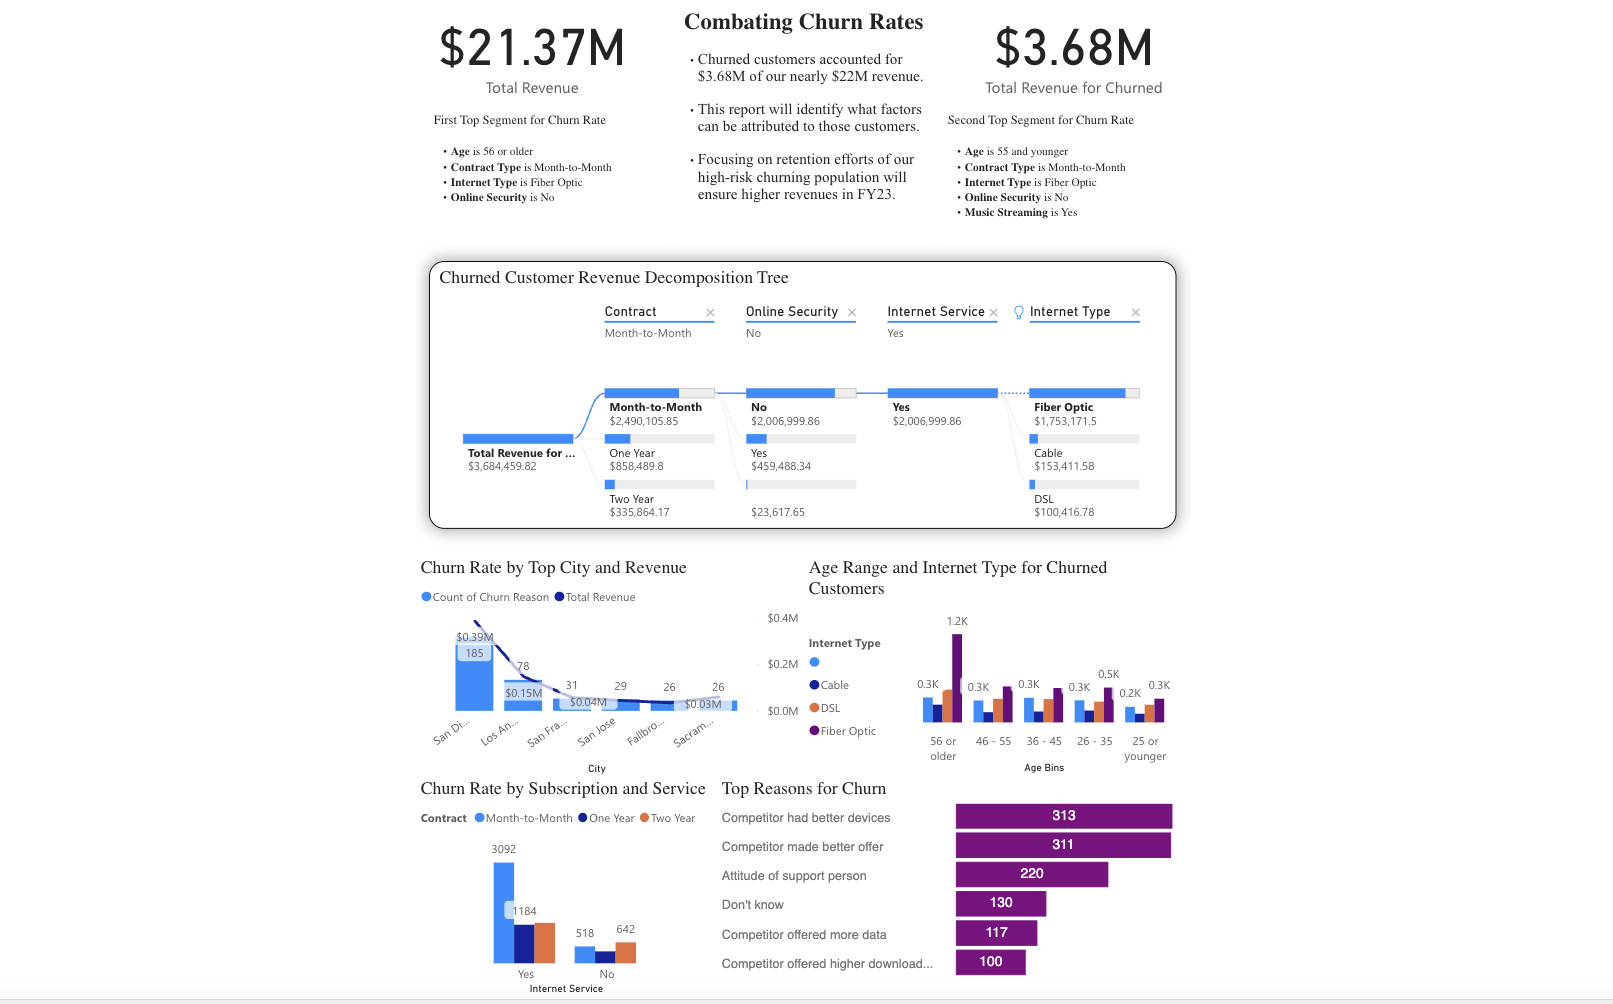
Customer Churn Dashboard
This is my Customer Churn Dashboard used in a competition.
-
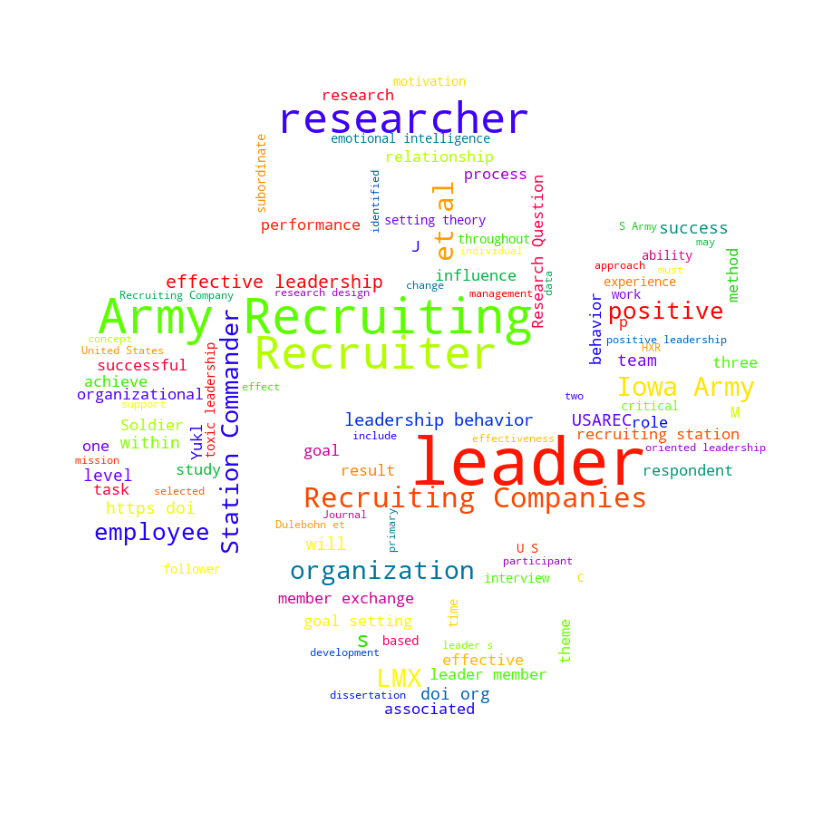
Natural Language Processing Project
Text analysis of my dissertation using NLP methods in Python.
-
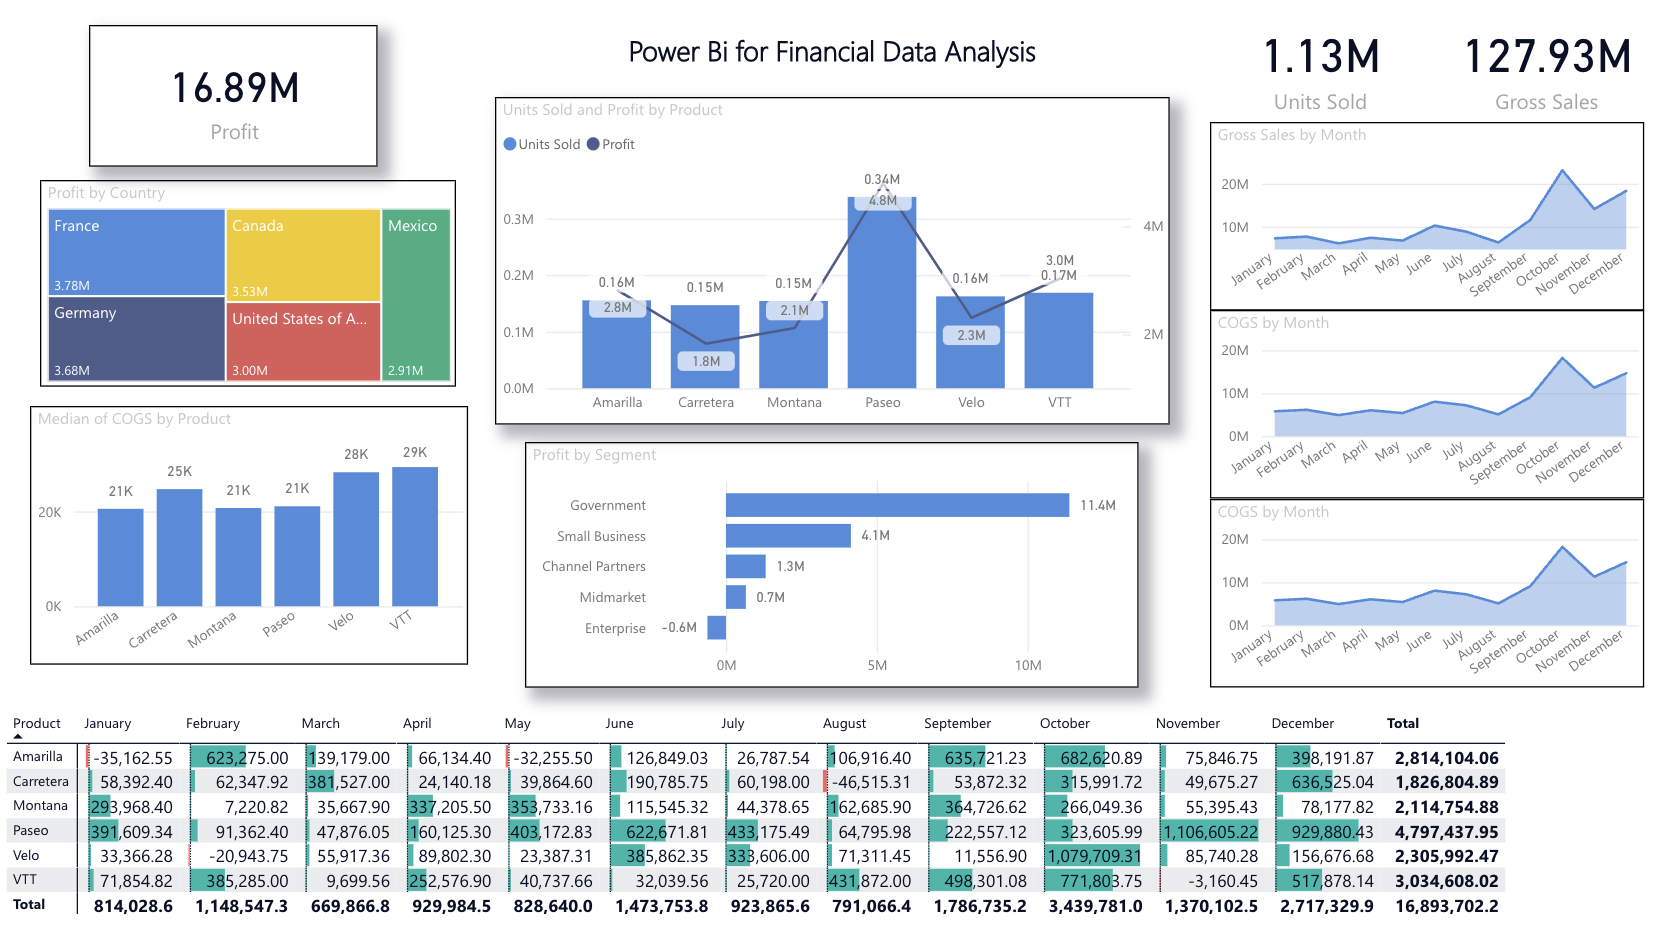
Power Bi for Financial Data Analysis
Analyzing vehicle sales by country, product, and sector in Power Bi.
Jupyter Notebooks
My favorite Jupyter Notebooks
Follow Me!
Check out my resume or follow me below!